Outline
|
 |
Lab 10
|
|
Transforming DistributionsOne of the most common transformations is to convert "raw scores" into z-scores. Z-scores are measured in standard deviation units. This transformation removes measures like feet or meters, and replaces them with a unit that can be interpreted as "how many standard deviations away from the mean is this point." The transformation is performed by using a z-score formula.
 These formula compute the deviation between a score and the mean of the distribution and divides it by the average (standard) deviation in the distribution. We noted in the last lab that the sample formula (using n - 1 to calculate s) is the default for standard deviation in most software; that is also the case for the z-score formula. Using SPSS For this section, you need
to download CSdata.sav.
This dataset of 224
observations includes factors considered in
college admissions: higih school GPA, high
school math, science, and English grades,
SAT-Math, and SAT-Verbal. To have SPSS compute
z-scores, go to the Analyze
menu, the Descriptive
Statistics submenu, and select
Descriptives. (note: the screen shots are
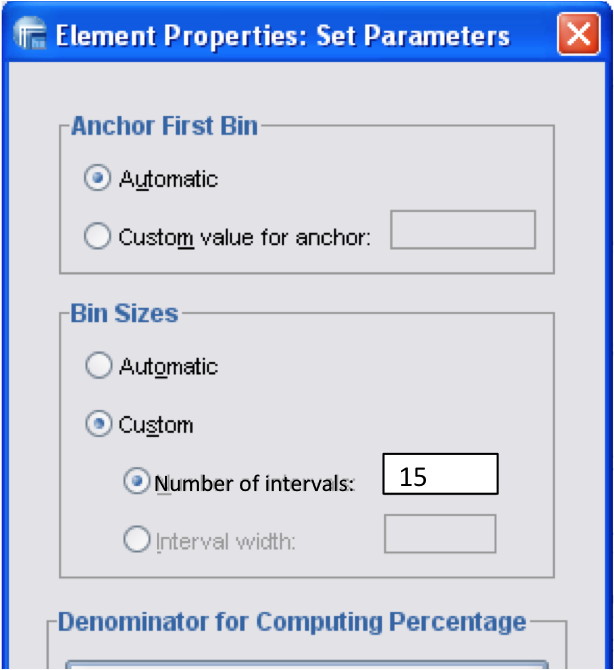
using a different datafile). Select a variable (satm) and then click the box for Save standardized values as variables. Click OK. That's all there is to it! (note: the screenshot uses a different variable) This created a new column (Zsatm) in the dataset, which includes the z-score for each satm data point. You can see them in the Data View and how the is defined new variable in the Variable View. On the latter, reduce the decimals to 3 and column (width) to 8. Now go to the top Data menu and sort by satm. Scroll down and check whether all Zsatm scores all also in order. Use SPSS to find basic descriptive statistics for Zsatm: Mean, Std. Deviation, Minimum, and Maximum. Now make histograms of the original (satm) and transformed (zsatm) variables. Shouldn't the two distributions be identical? Shouldn't the highest frequency for the central bar be the same in each? The answer is yes to both questions, but the SPSS procedure for deciding on the number of intervals did not yield the same result for both. When you want to compare histograms, you need to go the Elements Properties page of Chart Builder for each of the histograms and click on the button Set Parameters. In Bin Sizes, click on Custom and for Number of Intervals enter 15. (You can try this with whatever number you want later, but we'll start with 15). Your page should look like something like this.
Click Continue to close the window and return to the Elements Properties main page. Be sure to click on Apply. Then back on the Chart Builder main page, click OK. When you have done this for satm and zsatm, compare the histograms. There may be some very minor differrences related to satm having only integers as scores and zsamt being a continuous scale.
(2) Converting every score in the distribution (Math SAT) to a z-score with SPSS. To do this we need to go to "Analyze", "Descriptive Statistics", "Descriptives". Then check the box labeled "save standardized values as variables". After performing this operation, check the data window. There should be a new variable (called something like zsatm). (a) Using SPSS make a
histogram of the new zsatm variable, what
does it look like (what is the shape)?
How
does it compare to the original satm
histogram?
Using Standard Scores to Compare Different Distributions
Consider the following example:
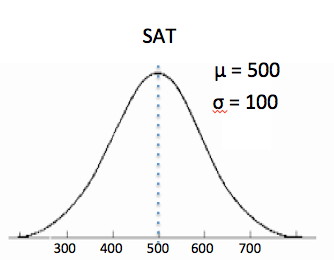
Consider the following situation. You take the ACT test and the SAT test. You get a 26 on the ACT and a 620 on the SAT. The college that you apply to only needs one score. Which do you want to send them (that is, which score is better, 26 or 620?).
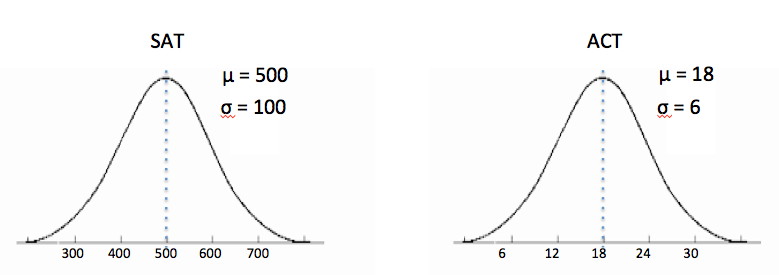 It is hard to do a direct comparison here because the two distributions have different properties: different means, and different variabilities. How might we go about it?
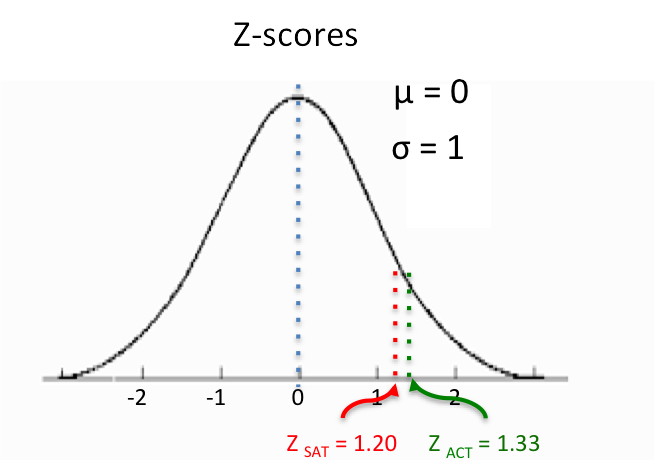
Step 2: think about cumulative percentiles and percentile ranks -- this will work Step 3: try to take the deviations and standard deviations into account by converting all the scores to z-scores
So to be able to make a comparison, one approach would be to transform both distributions into a standardized distribution. We can transform any and all observations or
values from a distribution to a z-score if we
know either the μ & σ, or the
(4) Suppose instead that you got a 600 on the SAT and a 24 on the ACT. Now which score is better?
Attach your Worksheet and SPSS output files to the LAB 10 ASSIGNMENT.
|
||||
|
|
||||