Outline
|
 |
Lab 5: Sampling & Basic
Probability
|
|
Most of our research questions are concerned with large groups of individuals. However, it is usually the case that we can't test all of these individuals (usually because of resouce limitations like not enough time and/or money). So, while we're interested in looking at the large group as a whole (our population) we typically only look at a subset of individuals (our sample). A result of using samples is that the interpretation of analyses that we make about populations is grounded in probability. Today's lab focuses on some of the basic differences between populations and samples, and the impact of these differences on our research questions. We will start with a bit of discussion about samples and populations, then discuss some basic probability theory, and then bring these two topics together. Populations and Samples
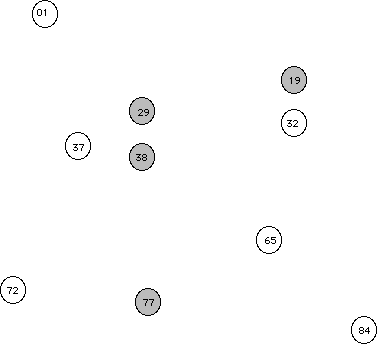
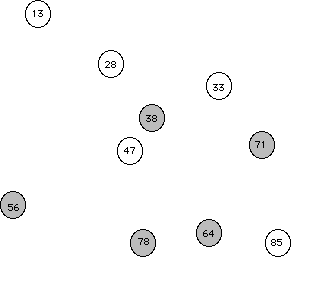
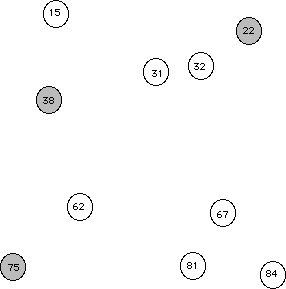
Let's begin by looking at a picture of a population.
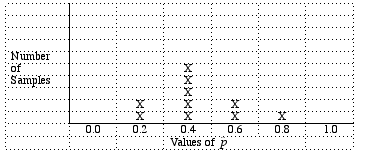
Suppose that the congressperson's staff decided not to do random sampling, but instead decided to just call individuals from the same area code (trying to save money on those long distance charges). This sampling method is an example of convenience sampling (selecting the individuals of the population that are easiest to reach). So let's reconsider our population of individuals along with an overlaid area code map. Random eventsWhat the above exercise is an attempt to show is that, while random events are somewhat unpredicatable in the short term (e.g., if you only take one or two samples, but that in the long term, across many repeated samples, random events usually have regular and predicatable pattern.
|
||||||||||||
Basic probability
- Any probability is a number between 0 and 1.0 (some people find it easier to think in terms of percentages, so 0 to 100%)
- All possible outcomes together
must have a probability equal to 1.0 (again, all
possible outcomes add together to make 100% of the
outcomes)
- The probability that an event
does not occur is 1 minus the probability that it
does occur. (so if there is a 20% chance of
something happening, then there is a 80% chance
that it doesn't happen)
- If two events have no common
outcomes, then the probability that one OR
the other occurs is the sum of their individual
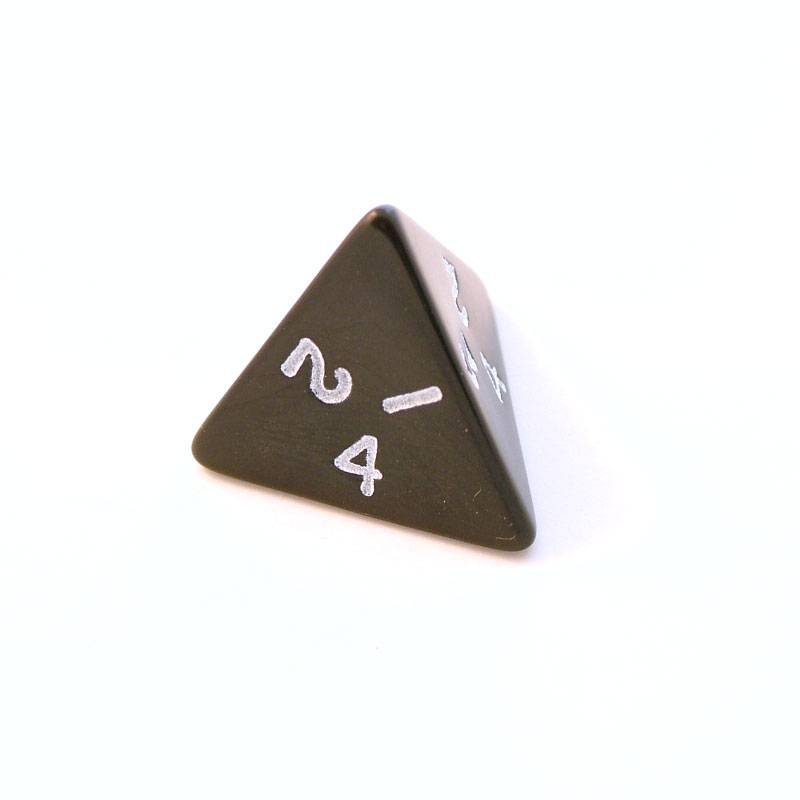
probabililties. (so if you roll a four-sided die,
there is a 25% chance of getting each outcome
1,2,3, or 4. The chances of getting a 1 or a
4 is 25% (for a 1) plus 25% (for a 4) = 50%
chance).
- The probably of two independent
outcomes both happening (A AND B) is the
product of their two probabilities. p(A) *
p(B). (using our 4-sided die example
again. If we rolled the die twice, what is
the probability of first rolling a 1 AND then
rolling a 4? 25% (rolling a 1) times 25%
(rolling a 4) = 6.25%)
We deal with probabilities everyday.
-
- lotto tickets, weather
forcasts, medical reports on the news (e.g., risks
of cancer)
In a situation where several different outcomes are possible, we define the probability for any particular outcome as a fraction or proportion. If the possible outcomes are identified as A, B, C, D, and so on, then:
| Probability of A = | number of outcomes classified as A |
| total number of possible outcomes |
| The total number of possible outcomes (the bottom part of the equation) is called the sample space S |
Some Rules of probability
Consider a concrete example:
-
You are playing War (the card
game) with your kid sister, each of you has your
own deck of 52 cards. She picks the Queen of
hearts from her deck. What are the odds that
you'll pick the Queen of hearts from your deck?
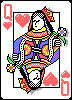
There are 52 different cards in a deck, so the sample space is 52. There is only one queen of hearts. So:
 prob of Q-hearts =  ____picking the Queen of hearts ___
		    total number of possible cards picked
= 1/ 52
Notationally we can express this
probability as: p(Q♥) = f / N = .019
f = the frequency of queen of
hearts in a standard deck of cards
N = the total number of possible
cards picked
Now let you try a few.
-
6) What is the probability of
selecting a red card from a standard deck of
playing cards (remember that there are two red
suits: ♥ and ♦)?
7) What is the probability of selecting a club (♣) from a standard deck of playing cards?
8) What is the probability of
selecting a club (♣)
or a heart (♥) from a standard deck of
playing cards?
9) What is the probability of
selecting a 7♣ or 7♥
from a standard deck of cards?
10) In each of the following situations, describe the sample space (i.e., possible outcomes) for the random phenomenon.
-
a) A seed is planted in the
ground. It either germinates or fails to grow.
b) A patient with a usually fatal form of cancer is given a new treatment. The response variable is the length of time that the patient lives after treatment.
c) A student enrolls in a statistics course and at the end of the semester receives a letter grade.
d) A basketball player shoots four free throws. You record the sequence of hits and misses.
e) A basketball player shoots four free throws. You record the number of baskets she makes.
-
Note: (d) and (e) are
different! In one case the are taking the "sequence"
into account. Think about how that changes the
question. Hint: the sequence takes the
order into account, but the number of baskets
does not. So the sequence Hit-Miss (made the
first, missed the second) is different than
Miss-Hit (missed the first, hit the
second). But if we were just counting
the hunber of made baskets, they'd both be the
same (1 Hit).
Probability and Samples
-
In the final section of our lab we will start bringing
sampling and probability together (we will do this in
greater detail in later labs).
Imagine the following situation. You are Jack and you are on the way to town to sell your cow. You are approached by a stranger who claims to have "magic" beans. He produces a bag, and pours out 10 beans, 2 are white and 8 are black.

The black beans, he says, are magic, but the white are not. He places the beans back into the bag and places it into his pocket. He then offers to buy your cow for his bag of beans. However, you a somewhat suspicious when he pulls the bag back out of his pocket. You ask to see the beans again, but he refuses. He claims that if he removes the beans too often the beans black beans will lose their magic, changing color from black to white. You say "Well, how do I know that's the same bag you showed me?" He agrees to allow you to remove four beans from the bag. You agree and he pours out four beans, 1 is white, the others are black. Do you, as Jack, think that the bag is the original bag with 2 white and 8 black beans?
Let's bring the story back to our statistical
discussion. We can consider the original bag of beans
our population and the two beans that he showed
us from the current bag our sample. Our question
here is, looking at the sample can we know for certain
whether the current bag is the original bag or not?
Because we can't see the contents of the entire bag, we
can't know for sure. However, we can take into account
the probability of getting particular samples.
In the situation described in the story, the population
bag had 80% black "magic" beans (8 out of 10). The
sample of 4 beans had 75% black beans. 75% is pretty
close to 80%. The likelihood of selecting this sample
from the original population is fairly high. So Jack
will probably conclude that the current bag is the same
as the original bag.
However, suppose that when the stranger had poured out a
different sample of 4 beans. What would you have
concluded if the sample had consisted of 2 white and 2
black beans? Here there is a larger difference between
the proportion of black to white beans in the sample and
the original population. This sample is still possible,
however it is less likely than the earlier sample. So in
this situation, Jack may be more likely to think that
the current bag is not the original bag and that the
stranger is trying to pull a fast one. What if the
sample had 3 white and 1 black. Then Jack would
know for sure that the bags had been switched (the
original back only had 2 white beans, so a sample from
it can't have 3).
This is the kind of situation that a researcher is
often in, trying to look at a sample of observations and
make a decision about what population the sample came
from. For now, we're just trying to get this at an
intuitive level, but later in the course (especially
aroung lab 15) we will learn how to quantify the
probabilities used to make these kinds of decisions.
11) Consider the following populations and samples. For each try to decide which population the sample was more likely to have been drawn from.
a) A standard deck (population 1) has
52 cards, one copy of Duece (2) through Ace for each
of the four suits (
♥,
♦,
♣,
♠); a Pinochle deck (population 2) has
48 cards, two from each of the four suits, 9 through
Ace (9,10,J,Q,K,A). If you were dealt 9♥, 10♠,
J♣, K♠, A♥ (our sample), which deck
(population) is this hand more likely to have come
from? How
certain do you feel about your choice?
b) At the local game store you pick up
two 6-sided dice. One die is a "true" die,
with which the chances of rolling a 1, 2, 3, 4, 5,
or 6 are all equivalent. The other die is a
"loaded" die, that has been weighted so that the 1
happens very infrequently, the 6 occurs more
frequently than usual, and the 2, 3, 4, & 5
occur at their normal rates. The two dice look
the same and you forget which is which. So you
decide to pick one of them and roll it 6 times (our
sample). Suppose that your sample roll is: 1,
1, 3, 2, 6, 2. Which die do you think you
selected, the "true" die or the "loaded" die? How certain do you feel about your
choice?